Tuesday, October 30, 2012

Elliott wave analysis of EUR/USD; GBP/USD; EUR/JPY and EUR/NZD

 EUR/USD - Okay the triangle scenario seems to be the right one (good guess...). That means we should be looking for a rally higher towards resistance near 1.3110. Remember we don't have to hit this resistance level. We could easily see a high at 1.3065, which will end wave D, but only time will tell where wave D ends. However, once wave D is in place it's then things begin to be interesting, because we then need the final E-wave in the triangle, before we break out of the triangle to the UP-side.
 GBP/USD - Is ready to take on the resistance line back from the 1.6310 high again. Notice the Inverted S/H/S formation that has been building and will be triggered if this resistance line breaks. The target for this Inverted S/H/S is at 1.6380. A break above 1.6310 would on the other hand trigger a possible double bottom with a target at 1.7345.
 EUR/JPY - The big question is whether we have seen red wave ii finish or it's still ongoing? If resistance at 103.39 protects the upside for a break below 102.59, the we know red wave ii is over and a new decline towards 101.45 is under way. However, a break above 103.39 indicates that red wave ii is still ongoing and that we should see a move a little higher towards 103.59 before down.
EUR/NZD - With the break above 1.5789 yesterday is the first good indication, that the big expanding flat correction from the 1.5967 high is over and a new powerful rally is well under way. A break above 1.5820 confirms the bottom and the rally higher. Only a break below 1.5705 will indicate that we still need one more new low near 1.5652 before higher.

Monday, October 29, 2012

Elliott wave analysis of EUR/USD; EUR/JPY and EUR/NZD

 EUR/USD - I think the Triangle concept has just grown on me. I like it more and more and I think we could see one more low closer to the 1.2860 - 1.2870 area, before wave C is done and wave D starts building. I would be looking for wave D to top out near 1.3110.
 EUR/JPY - We might see the ongoing small correction a little higher, but once it's done we should see the next powerful decline towards 101.45 on the way to the next ideal target near 100.19.
At this point only a break above 104.42 will invalidate this count and call for a new high above 104.59, but that is not my preferred count at all.
EUR/NZD - Did we see the C-leg of the expanded flat correction from the 1.5967 high end with the test of 1.5690 yesterday? It's clearly a possibility and a break above 1.5787 will be the first strong indication, that is indeed the case, while a break above 1.5845 confirms the bottom and the next powerful rally higher. However, as long as resistance at 1.5787 has not been penetrated we still could see one last decline towards the ideal target-area between 1.5635 - 1.5652, from where the next rally could commerce.

Sunday, October 28, 2012

Elliott wave analysis of EUR/USD: EUR/JPY and EUR/NZD

 EUR/USD - I like the Triangle count more and more and think with would fit my count since the 1.2044 bottom perfectly. If the Triangle count is correct we could see a move a little lower in wave C before wave D higher takes over and should cause a minor rally towards 1.3110 around November 13. That said we still can't exclude the flat correction, which would call for a break below 1.2825 towards 1.2740 be fore up.
 EUR/JPY - My count for a powerful decline in wave iii down from the peak at 104.59 is working perfectly and we should soon see the next powerful decline towards at least 101.85 and more likely 101.45 on the way towards the ideal target for this correction at 99.35.
EUR/NZD - We just need one more decline towards the 1.5935 - 1.5952 to end this c-wave of the expanded flat correction and set the stage for the next powerful rally higher. A break above 1.5777 and more importantly 1.5845 confirms that the expanded flat since the 1.5967 peak is over and wave iii of 3 is under way - Stay tuned!

Elliott wave analysis of EUR/TRY and AUD/NZD

 EUR/TRY - It has been quite a while since I have last spoken about this cross, so please take a look at my post from July 30 first: http://theelliottwavesufer.blogspot.dk/2012/07/elliott-wave-analysis-of-eurusd-usdjpy_30.html.
Once the cross broke below 241.28 in early January 2012 I just kept holding on to my call for a decline to the double top target near 2.20 and made a very nice 8% profit on this cross and that is without the interest premium gained from be long TRY.
On July 30 I called for a correction towards 2.3062 in wave 4. However we have seen a move higher to 2.3662. The question whether we have seen the top of wave 4? A break below 2.3200 will be the first indication, that this is the case, while a break below 2.2988 will confirm, that wave 4 did indeed end at 2.3662 and wave 5 down to below 2.1829 is under way.
The risk is a break above 2.3662, which would call for a move higher towards 2.3842 and maybe even 2.4205 before down.

AUD/NZD - Could a big decline be just ahead in this cross? A clear break below support at 1.2316 will call for a much deeper decline, as that would trigger a big Shoulder/Head/Shoulder top with a target at 1.0935. The risk is a more prolonged consolidation above 1.2316 as a second right shoulder could be building, but longer term I still think that the real risk is to the downside here.

Thursday, October 25, 2012

Elliott wave analysis of EUR/USD; GBP/USD; EUR/JPY and EUR/NZD

 EUR/USD - We are just about to break below the support-line from the 1.2044 low. If we break clearly below here I will change my count to show a wave A peak at 1.3172 instead of blue wave 3.
The ongoing correction from 1.3172 could also turn into a B-wave Triangle instead of the flat correction I mentioned yesterday, but no matter, which corrective wave pattern is the right one, we need more time.
 GBP/USD - Is back at the resistance-line from the 1.6310 to confirm, that the correction is over and the next upswing is under way. A clear break above 1.6144 and more importantly 1.6178 will confirm that the correction from 1.6310 is over and a new rally higher towards 1.6618 and 1.6744 is under way.
 EUR/JPY - The c-leg of the expanded flat correction from 103.28 became a little bigger than expected. Wave c became 2.618 time wave a, which is a bit unusual, but not that rare. However, the expanded flat tells us, that we should expect an extended wave iii. I would look for an extension of at least 2 times wave i, which should target 101.75. The target for this correction is at 99.35.
EUR/NZD - We are about ready to see the final move down in red wave v towards the 1.5635 - 1.5652 area, which will end the expanding flat correction from the 1.5967 peak and call for an extended rally in wave 3 to at least 1.6481, but likely higher.

Wednesday, October 24, 2012

Elliott wave analysis of EUR/USD; EUR/JPY; EUR/NZD and Crude Oil

 EUR/USD - Big flat correction developing. We are currently in the c-leg, which should decline to 1.2740.
 EUR/JPY - We have just seen the top of wave 1 from 94.10 to 104.59. We should now be looking for wave 2, which is expected to unfold over the next month and cause a correction of at least 422 pips.
 EUR/NZD - The break below 1.5904 and more importantly 1.5788 has told us that wave ii is still unfolding. Wave ii is an expanded flat correction and should ideally reach 1.5635 before we can expect wave iii higher to begin.
Crude Oil - Is headed for a test of the support-line at 82.88 and a break below here confirm a continuation down to at least 78.62 and likely even lower.

Elliott wave analysis of EUR/USD; EUR/JPY; Facebook and Freeport McMoRan

 EUR/USD - Here I'm looking for a big flat correction, which means that we currently is in a large C-wave down. This C-wave should end below the bottom of wave A, ideally at 1.2740.
Short term a break below the support line from the 1.2042 low will add confidence in my count and will likely accelerate the decline.
 EUR/JPY - With the break below support at 103.15 we got the confirmation, that a top is firmly in place at 104.59. We should now look for a continuation down towards 101.85 as the next support. However, the long term target for this correction will be at 99.35.
 Facebook - First take a look at my post from October 20 here: http://theelliottwavesufer.blogspot.dk/2012/10/elliott-wave-analysis-of-apple-and.html
You don't get a more timely call for a bottom than that. Since the low at 18.80 we have seen a 25% rally, which clearly is what we can expect from a wave 3. The first target for wave 3 is at 28.43.
Freeport McMoRan Copper & Gold - As a proxy for Copper this stock is close to confirm a new powerful decline towards at least 28.70 and if this support (S/H/S neckline) breaks then we should be looking for a decline all the way back to just below 7.85. But for now it's a question of how prices will react to support at 38.80 and break will open up for a decline towards the neckline support at 28.70.

Monday, October 22, 2012

Elliott wave analysis of EUR/USD; EUR/JPY; EUR/NZD and DJI


Morning update

Evening Update 

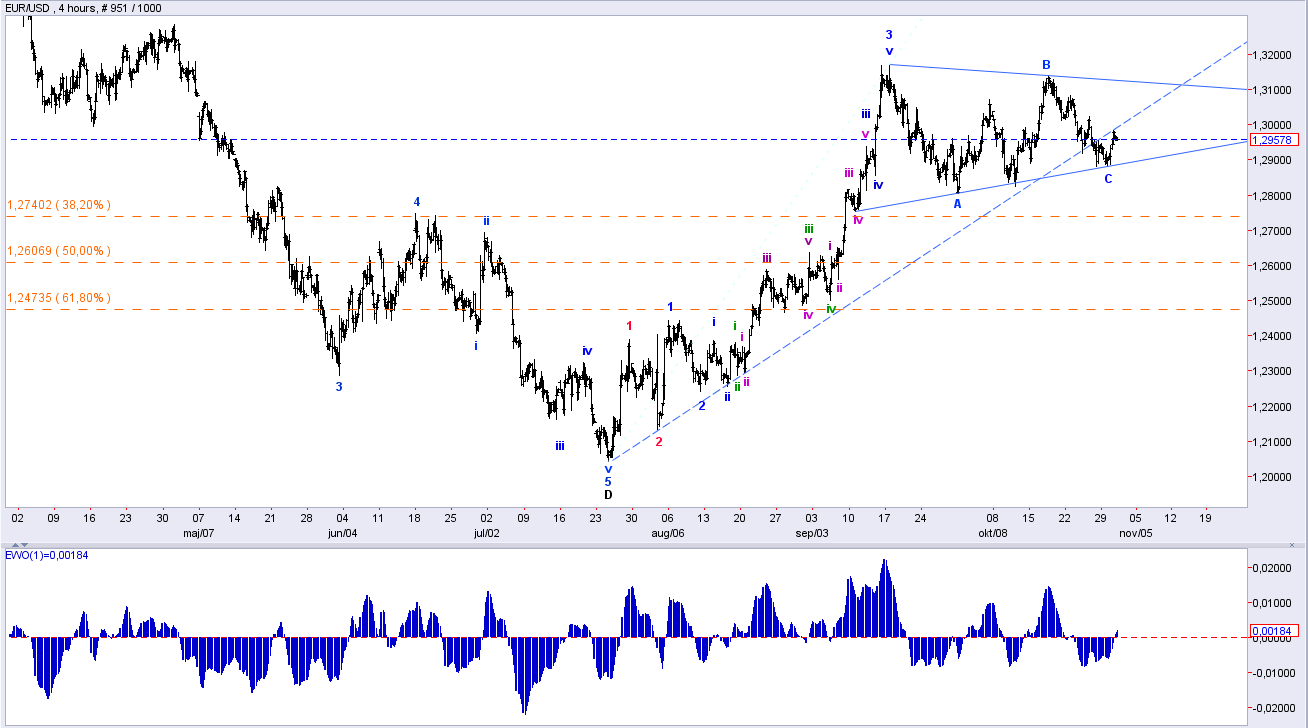
EUR/USD - Above is a 4 hour chart from this morning and one from this evening, what a difference. This morning the rally from 1.2825 still could turn out to be a five wave rally to end wave 5 up. However, looking at the evening chart, that is not an option any more. Instead it looks like a big flat correction is unfolding and if this is the case we should be looking for a five wave decline in wave C towards 1.2769 over the coming days.
Morning Update
Evening Update 

EUR/JPY - This cross was very close to a "Bulls-eye" at 104.71. However, it only made it to 104.59 (just 12 small pips from the ideal target). The decline from 104.59 is clearly impulsive in nature, which adds confidence in our count. What to expect now? We should see the biggest correction since the 94.10 low in both price and time. That means a decline of more than 422 pips and it should take more than a month to develop.
Short term a break below support at 103.15 will confirm a continuation down towards the first target for this correction at 99.35. This decline will of cause not be in a straight line and therefore we should look for the first minor low at or just below 103.15 for a correction of this first impulsive wave down. However, this correction should be followed by a new powerful decline.
Morning Update
Evening Update 

EUR/NZD - Looking at the other charts almost nothing has happened here. This could be a warning that we need a more complex correction, but it could as well just be a consolidation gathering power for the next rally.
A break below 1.5906 calls for a more complex correction, while a break above 1.6010 calls for the next rally higher towards 1.6061 and 1.6127 
Morning Update
Evening Update

Dow Jones Industrial Index - Yesterday DJI closed below the minor support line and today we are witnessing a powerful decline confirming the break. So we should have our attention towards the downside for a test of the next support (the red dotted line) near 12,686 and a break below here will do some massive technical damage and call for a decline to the bottom of the channel near 11,200.

Elliott wave analysis of Gold and Silver

 Gold - Double click on the charts to see the text.


Silver - Double click on the charts to see the text.

Saturday, October 20, 2012

Elliott wave analysis of Apple and Facebook

..
 Apple - See my post from October 8 here first: http://theelliottwavesufer.blogspot.dk/2012/10/elliott-wave-analysis-of-eurusd-eurjpy_8.html.

With the clear break below 617 there should be no doubt anymore. Wave 3 peaked at 703.86 and we should be looking for a multi month and pretty deep correction. As a minimum I am looking for a decline towards the 522 -556 area. More likely we will see 522 than stop at 556 and head higher.
As wave 2 was a simple deep zig-zag correction we should be looking after some kind of flat correction or a more sideways drawn out triangle, but it's way to early to tell which kind of correction will play out

Facebook - The bottom of my target area between 18.79 - 19.77 has now been tested with the low yesterday at 18.80. There is no more room for correcting to the downside and we should now been looking for a break above 20.48 as the first indication that the correction form 23.36 is over and a new powerful impulsive rally has begun. Longer term I'm still looking for a rally to at least 27.37 and likely even the top of wave B at 33.45.

Friday, October 19, 2012

EUR/JPY is facing major overhead resistance


EUR/JPY - Is facing strong overhead resistance. At the weekly chart above we can see that the long term resistance line of the ending diagonal is just above the current rate for this cross. At the same time we have seen a five wave rally from the 94.10, so we should be very close to a top for this wave 1 of one larger degree. However, longer term I expect that this resistance line will be broken and that we will see a move to much higher levels and the first major target will be 111.43.

Looking at the 4 hourly chart we have made a new high above the September 17 high at 103.84, which fulfils all requirements for the five wave rally of the 94.10 low. The ideal target for this rally will be at 104.71, which should mark wave 1 of one larger degree and from where I expect a wave 2 correction, that will be bigger than any of the correction we have seen since the 94.10 low in both time and price. So be ready for a top and relatively sizable correction soon, but first lets get the top of wave 5 in place at 104.71.

Thursday, October 18, 2012

Elliott wave analysis of EUR/USD; GBP/USD; EUR/JPY and EUR/NZD

 EUR/USD - Is currently correcting in wave iv of 5. This minor wave iv is expected to end between 1.3037 and 1.3060 for the last rally higher towards the target area between 1.3283 - 1.3315, from where will should experience a bigger decline.
 GBP/USD - Wasn't able to break above the resistance line at 1.6167, which needs to be broken to confirm that the correction from 1.6310 is indeed over. However it will take a break below 1.6021 to confirm, that a more complex correction from 1.6310 is ongoing. As long as support at 1.6021 holds firm I will be looking for a break above 1.6167 as the most likely scenario. A break above 1.6167 will open up for a rally towards 1.6310 on the way towards 1.6747.
EUR/JPY - As I said yesterday, this cross is the leader and here we have already seen a break above the September 17 high at 103.85. That means we can now count five waves from the 94.10 low and thereby the basic impulsive structure is fulfilled, however I do think that this is only a wave iv of 5, which ideally will end between 102.96 and 103.25 for the last rally higher towards 104.71, from where the biggest correction since the this impulsive rally started at 94.10 will be seen.
EUR/NZD - Has most likely already ended its blue wave ii and should be ready to take of in the powerful blue wave iii. A break above 1.5987 will confirm that the next rally is well under way. At no point should we see a break below 1.5873 and more importantly a break below 1.5788 as that would leave us with a three wave correction of the 1.5700 low and indicate that a more complex correction is ongoing.