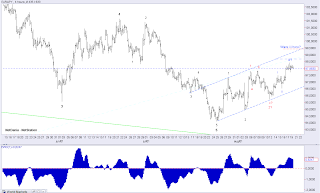
EUR/USD - Failure to break above minor resistance at 1.2386 Friday, was a bit surprising, but as long as support at 1.2255 protects the downside I will be looking for wave c of "Y" up to the 1.2550 area. A break above 1.2386 will confirm the next part of the correction towards the ideal target near 1.2550.
A break below 1.2255 will call for the alternate scenario, which see a decline close to 1.2040 in a flat correction before the final rally higher towards 1.2550.
USD/JPY - Has a nice dynamic look to the rally from 78.16 and after a minor correction towards the 79.25 - 79.40 area we should see the final red wave v towards the 79.83 - 80.19 area (ideally the target for red wave v will be found near 80.00), which will mark the end of wave iii and call for a shallow complex wave iv.
GBP/USD - Here I'm still looking for one last rally towards 1.5805 in a pretty complex correction that will end wave 2 that began at 1.5268. Once wave 2 is over we should see the much more dynamic and powerful wave 3 down towards at least 1.4780.
AUD/USD - Has ended it's X-leg from 0.9580. The X-leg stop at 1.0613 just 14 small pips from the ideal 1.0627 target I sat on August 6. and we should now see downward pressure in wave Z towards the 0.9650 - 0.9700 area. A break below 1.0320 confirms the decline.
EUR/JPY - Is still looking impulsive in its structure and a break above 98.68 will confirm a move higher towards 99.50. The risk is, that resistance near 98.68 protects the upside for a break below 97.47, which will leave us with an leading diagonal and call for a correction towards the 95.35 - 95.70 area before the next impulsive rally higher sets in.
EUR/NZD - Still lacks some real impulsive structure, but if my count is correct we are seeing a series of waves one's and two's, which should be followed by a much more powerful blue wave iii.
As long as minor resistance at 1.5434 protects the upside we could see blue wave ii to just below 1.5187 before the next powerful rally towards 1.5500.
Dow Jones Industrial Index - The ending diagonal as wave c of Y continues to build. I'm looking for resistance at 13.318, but even if we manage to break above the May high at 13.338 it will not change my view, that a big decline should be seen pretty soon.
A break above 13.338 will change my count slightly, as wave 2 is not allowed to break above the start of wave 1 therefore a break above 13.338 will indicate that wave B from 10.404 is still ongoing, but with very limit upside potential.
Facebook - Continues to follow the expected path that I laid out on August 10 (see my post here: http://theelliottwavesufer.blogspot.dk/2012/08/facebook-monthely-close-basis-facebook.html)
As we close in on the ideal target near 17.01 one should consider buying Facebook as a rally back towards 33.44 is expected. A rally like that would represent a 96% gain if one is able to bay a 17.01.


No comments:
Post a Comment