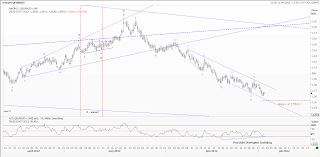
EUR/USD - I slightly prefer the above count, that blue wave 4 ended at 1.2747 and that we have begun blue wave 5 down to 1.2064 as the first target.
A break below 1.2551 will add credence to this count, but we need a break below support at 1.2460 to confirm that the above count is the correct one.
The risk is of cause a break above 1.2747, which will tell us, that blue wave 4 isn't over yet and a move higher towards the 1.2783 - 1.2824 area should be seen before we can consider blue wave 4 as done.
EUR/JPY - This count does look very much as the count above in EUR/USD. Here I am looking for one last decline in wave 5 towards 94.58. The question is whether wave 4 did end at 101.62 or wave 4 is still ongoing? A break below 99.61 will add confidence in the fact that wave 4 did indeed end at 101.62, but only a break below support at 99.48 will confirm it. As long as support at 99.61 isn't broken we could see 102.12
USD/JPY - We are in the early start of wave 3 towards at least 86.13. I would like to see a clear impulsive wave towards the upside in wave iii. A break above resistance at 80.00 will be the first good indication that red wave iii is under way for a rally towards 82.43 and maybe even higher.
Until the break above 80.00 and more importantly 80.59 is a reality the risk is that wave ii will be more complex.
EUR/NZD - Wave 5 has become extended and should ideally reach its target near 1.5533 actually it could even extend deeper towards 1.5352, but I would not count on that outcome at this point in time.
We can see the early signs of positive divergence building, which is a warning that a bottom might be close at hand.
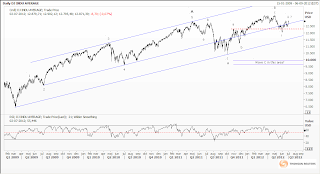
Dow Jones Industrial Index: Made a light new high yesterday, which do point us towards the 12,970 - 13,048 area as target for wave 2 of C. Longer term I'm still looking for a decline in wave C towards the 9,662 - 9,916 area, before the next big rally higher.
Shanghai Composite - Is well under way towards strong support near 2,000. Short term I expect resistance at 2,276 to protect the upside for the next move lower towards 2,143.
Gold - Is very close to it's ideal green wave 2 target near 1,611, from where risk again turns lower towards important support near 1,520. However it's only a break below 1,520 which confirms a much deeper decline. A break below 1,600 will confirm that green wave ii is done.
Silver - Is Silver about to confirm the next deep decline ? A break clear break below 26.00 will do a lot of damage to technical picture, but only a break below 21.24 will invalidate the alternate count (the lower chart), that a triangle is building and longer term a new rally above 49.51 should be seen.
If important support at 26.00 protects the downside for a new rally higher towards 32.84 I will give the triangle count slightly higher odds, but a break below 26.00 will raise odds, that important support at 21.24 will be broken too.
Crude Oil - Did the test of 77.28 mark an important bottom ? Not in my view I am still looking for much lower levels in Crude Oil. In My view the decline to 77.28 only marked the bottom of minor wave iii and we should now see a minor rally in wave iv towards 87.03 and maybe even 90.82, but for there risk again turns to the downside for a decline towards 72.65.


No comments:
Post a Comment