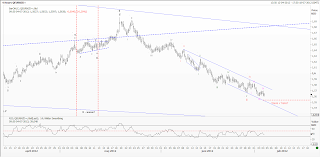
The price-action in EUR/JPY has been minimal, which warns us of a more powerful move once this consolidation is over. I still prefer the downside as the most likely, but as long as minor support at 99.62 isn't broken nothing is for sure. A break below 99.62 should accelerate the decline towards the ideal target near 94.58.
The risk is a break above 101.39 that would delay the decline a tell us, that wave 4 is still ongoing.
EUR/NZD - Is a different story as we are very close to the long term ideal low at 1.5533.
The decline from 1.6969 is a nice five wave decline, where wave v (ongoing) has extended and will be 1.618 the length of the distance travel from the top of wave i at 1.6969 to the bottom of wave iii at 1.6347. When wave v extends this is a quiet normal relationship, but it also warns us, that the coming rally will be quite powerful once the final low is in place.
Looking at wave v we can see some other interesting relationships between the red and pink waves. If we start with the relationships of the red waves at 1.5547 red wave v will be 0.382 times the length of the distance traveled from the top of red wave i at 1.6410 to the bottom of red wave iii at 1.5662. Finally looking at the sub-structure of red wave v (pink waves) at 1.5522 pink wave v will be 0.618 times the length of the distance traveled from the top of pink wave i to the bottom of pink wave iii.
That means we have a cluster of support in the 1.5522 - 1.5547 area, which well could mark the final long term low in this cross.
AUD/USD - As the rally from 0.9668 low now has entered into the area of what I previously counted as wave 1 the impulsive decline count has been invalidated and replaced with a new A-B-C count. That does not mean, that I have turned bullish longer term in this cross. I see the rally from 0.9668 as a new X-wave, which should be followed by a new decline longer term.
Short term we need for the ongoing X-wave to finish. I don't see much more upside, but we get to just below the prior B-wave high at 1.0399, before the next decline sets in.
NZD/USD - The picture here is almost the same as for Aussie above. I have broken the rally from 0.7473 down on an hourly basis (see the chart just above). As can be seen we should be very close to a top. If the top isn't already in place we need just one more high above 0.8063 to finish the rally from 0.7473.
A break below support at 0.7987 will be first good indication that the top is in place and call for a new decline to at least 0.7830, but the decline will probably be much deeper.
The only big question is whether the rally from 0.7473 will turn into a triple correction, but the price-action from the top will reveal that.
EUR/TRY - It has been quite a while since I have spoken about this cross, but as you can see we are now hoovering just above the 2.2125 target I mention in my last post (http://theelliottwavesufer.blogspot.dk/2012/05/elliott-wave-and-technical-analysis-on_03.html)
It's time to be more cautious as we get closer to this target and consider taking a nice well earned profit and just let wave 4 do it's thing. As wave 2 wave a simple zig-zag correction we should expect a shallow but complex wave 4.
Natural Gas - Should soon be ready for the next advance towards the 3.57 - 3.67 area. We now have a very nice inverted S/H/S bottom in place which should attract more positive attention. Longer term I'm still looking for much higher levels, but for now lets focus on the rally towards the 3.57 - 3.67 area.


No comments:
Post a Comment