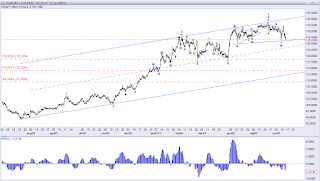
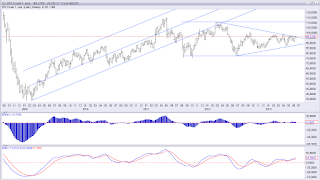
I'm lokking for a rally higher towards 131.27 or just above in red wave c. This should end wave b and be followed by wave c lower towards at least 124.96 and possibly lower. We are currently in the part of the correction since the 133.81 high, that has the lowest visibility. Therefore I'm working with the pattern, which I think has the highest possibility, but it could easily change into a new pattern. The other possible pattern will be, that the X-wave after the 126.15 low has turned into an running triangle (wave b ended lower than the start of wave a) and if this is the case we just about to finish wave e and begin the next powerful decline. If it is a triangle we should not see a break above 129.90.
EUR/NZD
The break above 1.6801 and more importantly, the break above 1.6847 has forced me to change my count slightly. Overall I'm still looking for a deeper correction towards 1.6388, but we will have to stay flexible, as corrections very easily can change shape, from one day to the next. With the break above 1.6847, that is exactly what we have seen. The best way to count the decline from 1.7111 down to 1.6578 is as wave w and we are currently developing an x wave, which ideally should rally higher to 1.6908, before the next decline towards 1.6388 is seen. However, a direct break below support at 1.6690 will indicate, that the X-wave ended early and the next decline lower already has begun.


