Wednesday, July 31, 2013

Elliott wave analysis of EUR/JPY and EUR/NZD

 EUR/JPY

The blue wave ii correction turned out to be an expanded flat correction as we saw the low of wave b at 129.33 (below the low of wave a) and the high of wave c at 130.79 (above the top of wave a). As long as support at 129.93 and more importantly support at 129.33 protects the downside, the correction could be more complex, than we already has seen. However, at this point I do not expect a more complex correction and will be looking for signs that blue wave iii is developing. The first sign will be a break below 129.93 and confirmation upon a break below 129.33, which will indicate that blue wave iii is indeed developing. The first target for blue wave iii will be at 126.07, where blue wave iii will be 1.618 times blue wave i. After an expanded flat correction we should always expect an extended impulsive wave to follow. As said, the risk is a more complex wave ii correction, which will be the case if support at 129.93 protects the downside for a break above 130.79, which would call for a move higher towards 131.17 - 131.36, but that is not my preferred count at this point.

EUR/NZD

We only saw the minimum correction to 1.6572 before the next rally pushed above the top of red wave i and confirmed that red wave iii is developing. Ideally support at 1.6634 now will protect the downside for a break above 1.6722 indicating the next powerful rally higher toward at least 1.6882 and long term much higher towards 1.7326. However, if support at 1.6634 breaks, then we will have consider the rally of the 1.6572 low as part of an complex correction and look for a continuation down to at least 1.6572 and likely lower towards 1.6477 before red wave iii will be ready to take over.

Tuesday, July 30, 2013

Elliott wave analysis of EUR/JPY and EUR/NZD

EUR/JPY

We are still in wave ii of c and I do expect it to move higher towards 131.17, where wave ii will have corrected 50% of wave i, but I would not be surprised to see a 61.8% correction of wave i, which would call for a rally towards 131.54, before wave iii takes over for a powerful decline. I will expect wave iii of c to be an extended wave and that would call for a decline towards 126.07 if a 50% correction turns out to be enough. Short term a break above 130.31 will indicate, that wave c of the correction is under way towards 131.17 and maybe 131.54. Only a direct break below 129.59 will indicate, that wave iii is already has taken over.

EUR/NZD

With an almost perfect test of strong resistance at 1.6686 (the high has been 1.6674) I think that a correction of this red wave i towards 1.6577 and likely deeper towards 1.6543 would be appropriate. However I can make a case, where we will not see a correction of that magnitude and if this is the case we will see a direct break above 1.6649 and more importantly a break above 1.6686 calling for a continuation higher towards 1.6762 and 1.6818 on the way towards 1.7326, which I believe will be the target for black wave iii.

Elliott wave analysis of US 10Y Yield - More upside to cover


US 10 Y Yield

I was asked if I have a Count for the US 10 Y Yield, normally I don't, but this would be my preferred Count both for the long term Picture and the medium term Picture.

I think we saw a triple zig-zag decline from the July 1981 high at 15.84% and saw the end at 1.56% in July 2012. That was a 31 year decline of 14.28 figures.

Looking at the daily chart we can see a nice inverted S/H/S bottom calling for an important long term bottom. The target for this inverted S/H/S bottom is near 3.36%.

From an Elliott wave perspective I would be looking for a much higher target with the first important target near 4.0%. I would not expect this target to be broken in the first attempt, but soon or later it will be broken for a rally much higher.

Elliott wave analysis of AUD/NZD - Short term bottom in place?

 WEEKLY
 
4 HOURLY

AUD/NZD

Please see my last post from July 4 here first: http://theelliottwavesufer.blogspot.dk/2013/07/elliott-wave-analysis-of-audnzd-long.html

Well as you can see red wave v and Black wave iii has extended from where I expected it to end in my post from July 4. However, that doesn't change the bigger Picture, which still calls for a decline towards the 1.0865 - 1.0935.

If we take a look at the short term Picture (see the 4 hour chart) we have seen or is very close to the bottom of Black wave iii and we should soon see Black wave iv followed by Black wave v lower. The price-action over the coming week will likely be way more choppy as we are entering a series of wave four's and five's.

Where should we expect Black wave iv to end? I will be looking at a correction higher towards 1.1623 and possibly even a move towards 1.1700, from where the next decline in Black wave v should be expected.

Monday, July 29, 2013

Elliott wave analysis of EUR/USD - Important top at hand?

EUR/USD

We are in the very last part of wave ii from the low at 1.2756. The rally of the 1.2756 low is clearly in three waves and wave c has an overlapping structure, which indicates it's an ending diagonal. This ending diagonal could be over with the test of 1.3297, but I would prefer to see one last spike higher towards 1.3320 before the top is finally in place and the powerful wave iii of 3 lower is to take over for a decline below 1.2756.

Short term a break below 1.3165 will confirm the top and that wave iii lower is developing. However, we are currently looking at a very powerful Trading set-up as we know we will be wrong if we break above the top of wave ii at 1.3415. That might seem far away, but considering the downside potential the risk is very low here. Remember we will never be able to enter a trade without risk. but we will like to make that risk as low as possible and as much in our favor as possible.

Elliott wave analysis of EUR/JPY and EUR/NZD

 EUR/JPY

We saw the end of minor wave five at exactly 129.59, which was my first target. The rally of the low at 129.59 indicates, that wave i of c is over and that wave ii is developing. It is most likely that this wave ii will retrace a great part of wave i, so I would expect to see a correction of 61.8% of wave i, which will take us to 131.54 before wave ii might be over. However, as second waves are allowed to correct all of wave the first wave we could see a move closer to the 132.74 top, but under no circumstances can a break above the start of wave i at 132.74 be allowed. Once this ongoing wave ii is done I will be looking after a powerful decline in wave iii, but first let's concentrate on wave ii higher.

EUR/NZD

With the break above 1.6486 we had confirmation, that a bottom is in place for a new impulsive rally higher. To confirm, that we have seen an important low for wave ii I would like to see a break above strong resistance at 1.6686 as well, as that will confirm continuation higher towards 1.6818 and 171.13. Short term I'm looking for support at 1.6527 and important support at 1.6482, which ideally protect the downside for the rally towards 1.6686 and higher.

Sunday, July 28, 2013

Elliott wave analysis of EUR/JPY and EUR/NZD

 EUR/JPY

With the break below important support we had the final confirmation we needed, that wave b did finish at 132.74 and wave c lower now is developing. Wave c is an impulsive, that means wave c can be broken down in five smaller waves. Three in the direction of the trend, which is down, and two waves against the trend, which would mean towards the upside in this case. We are currently about to end the first impulsive wave down from 132.74. The first target for this wave i is at 129.59 followed by 129.27 and 128.96. We believe the most likely target is near 129.27, but only time will tell. Once this minor wave i of c is over we should expect a correction towards 130.99 in wave ii before the next impulsive decline lower. 

EUR/NZD

I'm still looking for confirmation, that wave ii is over and wave iii higher is ready to take over. The first indication of wave ii being over will be a break above 1.6454 and more importantly a break above 1.6486, which will confirm a new impulsive rally above 1.6686 is developing. However, as long as resistance at 1.6454 has not been broken, we must accept the possibility of a deeper wave ii down towards support at 1.6349 and maybe even down to 1.6339, but that outcome is less likely. 

Saturday, July 27, 2013

Elliott wave analysis of GDX - Important bottom in place?

GDX - Gold Miners

Please see my post from April 18 here first: http://theelliottwavesufer.blogspot.dk/2013/04/gdx-is-closeing-in-on-its-shs-target.html.

This one is especially for Willem.

Willem asked me for my opinion on GDX and I made the post on April 18 2013 and boy did that Work out nicely. With a low at 22.21 just below the S/H/S target at 23.00 Not only did the S/H/S target Work out well, but also make a note on the bullish divergence, that was clearly noticeable on both indicators confirming, that a possible important low was close by at 23.00

But what if we didn't went long GDX near 23.00? Well the hourly chart below does show, that the rally of the 22.21 does have the potential of being an impulsive rally (five wave). However we have only seen three waves for now and is currently working on wave iv, which I think will be a flat wave or maybe a triangle, but it should alternate from wave ii, which was a zig-zag decline.

Once wave iv is over we should see one last rally higher. Ideally towards resistance near 30.00, from where we should expect a decline towards 25.25 before the next impulsive rally higher.


Elliott wave analysis of EUR/USD

 DAILY
 
4 HOURLY
 
 
EUR/USD
 
 
 On Wednesday I call the possible top of the ending diagonal that had developed since July 15. (Please see my post from Wednesday here first: http://theelliottwavesufer.blogspot.dk/2013/07/elliott-wave-analysis-of-eurusd-short.html)
 
 
In that post I said, that we needed a break below important support at 1.3160 to confirm, that wave iii lower was developing. However, we never saw a break below 1.3160 (the low came in at 1.3166) and since then we have seen a break above the top at 1.3255. That told us, that it wasn't wave v, but only the top of wave iii and we needed one more rally, which currently is ongoing.
 
The big question whether we have seen the top of wave v at 1.3297 or we need a Little more upside closer to 1.3320? I think we need a little more time and a move a little higher towards strong resistance at 1.3320 before this rally is over. Ideally I will look for a top near 1.3320 followed by a break below 1.3222 as the first indication of a top. However, we need a break below 1.3166 to confirm the top and that wave iii has taken over for a powerful decline towards 1.2756 and lower towards 1.1852 as the ideal target for wave 3.
 
From a Trading perspective the fact that this wave ii rally has come very close to the top of wave 2. Gives us the perfect basis for a low risk trade in respect to the possible reward. As we know, that this count is wrong, if we break above the wave 2 high at 1.3416 making the risk less than 100 pips against a possible reward of more than 1400 pips. It doesn't get much better than that.
Even if we wait to take on the more conservative trade, waiting for a break below 1.3166, that would still leave a possible rwards of more than 1300 pips.


Thursday, July 25, 2013

Elliott wave analysis of Natural Gas

Natural Gas

It has been some time since I have last looked at Nat. Gas, but I was asked to take a look at it Again, so here we go.

Please see my last post from June 9, here first: http://theelliottwavesufer.blogspot.dk/2013/06/elliott-wave-analysis-of-natural-gas.html

I'm still looking for a much higher rally towards 5.97 and possibly even higher. We are currently in a wave ii correction which could have ended with the test of 3.53, but we need a break above 4.04 to confirm that wave ii is indeed over and wave iii on its way higher towards 4.98 and my first target at 5.97.

To invalidate my Count it will take a break below support at 3.05. I don't expect that this decline will even come close to support at 3.05, but the unlikely event should happen and we break below 3.05, then we should look for support at 2.79.


Elliott wave analysis of EUR/JPY and EUR/NZD

 EUR/JPY

Minor support at 131.37 has been broken too and is yet an other sign of weakness. We still need a break below support at 130.76 to confirm, that wave b has finished and wave c taken over for a impulsive decline towards at least 124.96 and possibly even lower. Short term we will now find resistance at 131.44 and more importantly at 132.05 and only a break above the later will ease the downside pressure and call for a new rally higher towards 132.74 and maybe even 133.81, but that option seems as a low odds possibility. Therefore we should be prepared for a break below support at 130.76 rather than a move higher.

EUR/NZD

As we broke below important support at 1.6475 and even more important support at 1.6427 I have been forced to change my count. My preferred count is now, that wave ii still is in motion from the 1.6798 high. As we already is way past the 61.8% corrective target we will be looking for support at the Harmonic level at 70.7% (Gann target), which comes in at 1.6393 and again at the 78.6% Fibonacci level at 1.6349. However, it should be remembered, that second waves are allowed to correct 100% of the first wave, but it can never ever break below the start of the first wave, which in this case will be below 1.6225. However I doubt that this wave ii correction will be that deep. That said, I will be looking for a possible bottom at 1.6393 for a break above 1.6487, which will be the first indication, that wave ii could be over. However, we will need a break above 1.6686 to confirm the bottom for a continuation higher towards 1.6798 and higher in wave iii.

Wednesday, July 24, 2013

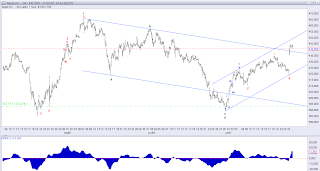
Elliott wave analysis of Apple and Facebook - New strong rallies to begin?


 Apple

Please seen my last Apple-post from July 7 here:
http://theelliottwavesufer.blogspot.dk/2013/07/elliott-wave-analysis-of-apple.html

We got a very deep wave ii to 391.50, but as I said we should not see a break below the start of wave i at 385.12 if the bullish Count was correct and it seems to be so. With a new five wave rally of the 391.50 low and now a break above the resistance-line from the top of wave i at 465.44 we should see the next part of the impulsive move higher. we are now entering red wave iii of wave iii higher and it should be a dynamite rally higher towards at least 544.00, but I believe it will be much strong and continue all the way towards 603, but time will tell.

Short term I would like to see a break above the base channel resistance line to confirm, that red wave iii is well under way.  

Facebook

Please see my post from May 25 here first: http://theelliottwavesufer.blogspot.dk/2013/05/elliott-wave-analysis-on-facebook_25.html

Well, as can be seen the count from May 25 didn't Work out as expected and I have had to change my longer term count (please see the new count above). However, the new count has not change the long term positive Outlook, which still call for much higher levels for Facebook.

As you can see above I place the end of wave 1 at 31.99 and we have seen a Deep wave 2 Down to 22.90, which was a Little below the 61.8% retracement of wave 1 and it seems wave 3 higher is well under way now. A break above the resistance line from the 31.99 high will be a very positive sign and I will be looking for an extended wave 3 higher towards at least 47.21 and possibly even higher.

Elliott wave analysis of EUR/JPY and EUR/NZD

 EUR/JPY

The very bumpy b-wave continues to work its way higher towards my ideal target, which is at the former high at 133.81. That said we have seen the first signs of this move getting weaker and it's loosing momentum all the time now. Therefore we are getting closer to the b-wave top and should be prepared for the powerful decline in wave c taking over. The first target for wave c will be at 124.96, but it could extend and break below 124.96 for a decline closer to the bottom of wave 4 of one lessor degree, which comes in at 118.73. Short term I'm looking for slightly higher levels as long as support at 131.37 and more importantly support at 130.76 protects the downside, but a break below 131.37 is a new clear sign of weakness, while a break below 130.76 will indicate, that wave c is developing.


EUR/NZD

It has been a disappointment to see yet another failure to break clearly above 1.6672. That said, I'm still looking for a powerful rally to take over soon in wave iii of 3. Short term we will ideally see support at 1.6526 protect the downside for a break above resistance at 1.6634 and more importantly a break above resistance at 1.6686, that confirms wave iii is developing. However, if support at 1.6526 breaks then we have support just below at 1.6495 and important support at 1.6476, which should not be broken at any time as that would force me to change my short term count. 

Elliott wave analysis of EUR/USD - Short term top in place?

EUR/USD

We have just or is very close to ending wave ii of 3 and should soon see a powerful decline take over as wave iii of 3 develops.

Short term a break below 1.3163 will confirm, that wave ii of 3 is over and wave iii of 3 is developing.

As long as support at 1.3190 and more importantly support at 1.3163 protects the downside we could see one last stab higher towards 1.3270, but I would not bet on that outcome.

Stay tuned for a powerful decline soon.

Tuesday, July 23, 2013

Elliott wave analysis of Gold

Gold

Wave c of 4 became an extended wave and is very close to being 1.618 times longer than wave a of 4. As can be seen on the chart above. The last move higher towards 1,349 has been followed by a clear negative divergence on the EWO indicator, telling us, that this a weak rally and a top should be nearby.

It should also be noticed, that the entire rally since the 1,180 low has been contained by the rising channel, which is a strong indication, that this rally is corrective and not impulsive. If this rally had been impulsive we would have expected a clear break above the base-channel in wave three and we haven't seen anything close to a break above the channel resistance line. So be ready for a top very soon and a powerful decline in wave v to below 1,180.

Elliott wave analysis of GBP/USD


GBP/USD

My preferred Count is shown above. We ended a major wave 4 triangle in early January 2013 and have since seen wave 1 and 2 of the final thrust lower. We are currently in wave ii of 3 and I expect this ongoing wave ii to end near 1.5435, where wave ii will have corrected a little over 61.8% of wave i. Once this wave ii of 3 is over we should see a powerful decline in wave iii of 3 towards 1.3886 and possibly even lower, but only time will tell.

Elliott wave analysis of EUR/JPY and EUR/NZD

 EUR/JPY

We have been locked in a price range between 130.71 and 132.27 since late Friday. However, I'm still looking for a continuation higher towards the next minor resistance at 132.78 and possibly higher towards my ideal target near the former high at 133.81. That said, I regard this rally as part of a complex flat correction and once this rally is over we should see an impulsive decline towards at least 124.96 and possibly even lower. Short term support at 130.72 should protect the downside, but we will need a break below strong support at 129.67 to confirm, that this b-wave rally is over and wave c lower is developing.

EUR/NZD

I'm looking for a powerful rally to take off any time now. A clear break above 1.6603 open up the upside for a impulsive rally higher towards 1.7364, where wave iii will be 1.618 times longer than wave i. However, this rally could become even more extended and rally higher towards 1.7929, but only time will tell. Short term I'm looking for minor support at 1.6552 to protect the downside for the break above 1.6603, but even if we does see a break below 1.6552 the downside should be limited and at no point should we break below 1.6476 as that would delay the expected rally higher.

Monday, July 22, 2013

Elliott wave analysis of EUR/JPY and EUR/NZD

 EUR/JPY

With the break below support at 131.05 we have gotten the first sign, that the b-wave rally since the 124.96 low is becoming weaker. It is still to early to tell whether wave b has terminated or we can expect more upside, closer towards the former top at 133.81. To confirm that wave b has terminated we need a break below strong support at 129.67 as long as this support protects the downside we should stay focused towards the upside for a continuation of this bumpy b-wave, closer towards the former top at 133.81. However a break below 129.67 will confirm, that the b-wave has terminated and wave c lower towards at least 124.96 and possibly lower has taken over.
EUR/NZD

Yesterday we did see a break above resistance at 1.6638, but the break was not sustained and the following decline has been deep. However, I'm convinced that we have seen the low of wave ii at 1.6427 and it is just a matter of time before we will see the next powerful rally higher towards at least 1.6815 short term. Longer term I'm looking for wave iii higher towards at least 1.7364 and possibly much higher. Wave ii has been an expanded flat correction and the impulsive rally to follow an expanded flat correction will likely be an extended rally it self, therefore a rally to minimum 1.7364, where wave iii will be 1.618 times longer than wave i should be expected. At this point only a break below 1.6427 will force me to change my count, but the possibly downside should be limited to 1.6383 and just maybe 1.6338 before the next rally higher.

Sunday, July 21, 2013

Elliott wave analysis of EUR/JPY and EUR/NZD

 EUR/JPY

After the break above the channel resistance line I'm looking for a rally back towards the top at 133.81 in a flat correction, which would mark the b-wave and should be followed by the c-wave lower towards at least 124.96 and possibly lower. Short term we would like to see minor support at 131.05 protect the downside for a break above 131.84 and more importantly a break above 132.27, which confirms a continuation higher towards 132.59 and 132.78 before my ideal target at 133.81. That said, it should be remembered, that all conditions for the flat b-wave rally already has been fulfilled, so we will have to be aware of signs, that the b- wave should be over and the c-wave decline ready to start.

EUR/NZD

The rally from 1.6558 to 1.6685 was a minor five wave rally, but it was a c-wave rally and not the first wave of an impulsive rally. That meant, that resistance at 1.6685 protected the upside for a break below the important low at 1.6558, which forced us to re-count the rally of the 1.6225 low. Instead of having a 1-2; 1-2 count, we have placed wave i from 1.6225 to 1.6798 and wave ii most likely ended with Friday with a low at 1.6427 (just below the 61.8% of wave i) and I will now be looking for wave iii higher towards 1.7353, where wave iii will 1.618 times longer than wave i. However, short term we need support at 1.6427 to protect the downside for a break above 1.6636, which would confirm that wave iii is developing. Only a break below 1.6427 will delay the upside for a decline closer to 1.6390 before higher again.

Thursday, July 18, 2013

Elliott wave analysis of Palladium

 Monthly
 
Weekly
 
 
Palladium
 
Ryan asked me to take a look at Palladium, so here we go.
 
Since the top in early 2001 at 1,090 we have been in a major correction. We saw a three wave decline from 1,090 down to 148.50 in early 2003, which I have counted as wave W and the following rally has been a very complex X-wave, which I expect to end near the old top at 1,090. However, we are currently in a wave 4 triangle, we will take longer to finish before the last rally higher towards 1,090. Once this X-wave is over near 1,090 we should see a new massive decline towards the low near 148.50. 
 
So enjoy this rally for as long as you can, but the future outlook, once this X-wave is finished is not that bright. 

Elliott wave analysis of EUR/JPY and EUR/NZD

 EUR/JPY

After the break above the falling channel resistance line, we working our way higher towards the top at 133.81. This weak rally will, as I have said, be a bumpy ride, with lots of deep set backs and once this rally is over, we should look for a new decline towards at least 124.96 and possibly lower. Short term I'm looking for support at 131.06 to protect the downside for the next rally higher, which a break above minor resistance at 131.75 will confirm. However, if support at 131.06 breaks we should not expect a deeper decline, than to 130.79 before the next rally higher.

EUR/NZD

The minor road-map I laid out yesterday has pretty much described the price action. However, the decline from the top at 1.6685 (we expected a top at 1.6675) has be deeper than our expected 1.6603 as we have seen a low at 1.6565. The rally from 1.6557 to 1.6685 was a minor five wave pattern and therefore I have counted it as the first minor wave of red wave iii higher towards 1.7248. If this count is correct, then we must allow for a 100% retracement of this minor wave one, but we can not allow just a single pip below 1.5758 as that would force me to adjust my present count. That said, I'm still expecting support at 1.6565 to protect the downside for a break above minor resistance at 1.6633 and a break here will confirm the bottom for a rally back to 1.6685 and higher towards 1.6762 and 1.6817 on the way towards 1.7248.

Elliott wave analysis of Gold


Gold

Please see my post from July 14 here first:
http://theelliottwavesufer.blogspot.dk/2013/07/elliott-wave-analysis-of-gold-be-ready.html

As we broke above minor resistance at 1,288.54 we knew, that we need one more rally above 1,289.98, which was exactly what we saw yesterday with the rally to 1,300.63. The quick return lower from 1,300.63 indicates, that the correction from 1,180.20 is over and we should now expect a new low below 1,180.20. The ideal target for red wave v will be at 1,111.45.

Wednesday, July 17, 2013

Elliott wave analysis of EUR/JPY and EUR/NZD

 EUR/JPY

Not much has change since our analysis yesterday. We saw a test of the first minor target at 131.37 (the high was at 131.36), from where prices where rejected, but it should only be a matter of time before this minor resistance is broken for a continuation higher towards our next target at 132.48. As I said yesterday, this will not be a smooth ride higher. It will be bumpy with lots of moves, that seems out of character. However, I see the rally of the 124.96 low, as part of a very complex correction and nothing more than that. Once we have reached the target for this part of the correction, I will be looking for one more decline towards at least 124.96 and possibly even lower towards 118.73, but only time will tell.


EUR/NZD

Yesterday we did see an attempted to break above important resistance at 1.6756 (the high came in at 1.6762), but it failed and caused a deeper than expected decline to 1.6558. The decline below 1.6582 has forced me to change my short term count slightly. With the break below 1.6582 it was confirmed, that we still was in red wave ii. Red wave ii is an expanded flat correction and that means we will be looking for a extended red wave iii once it is confirmed, that red wave ii is over. I do think we saw the bottom of red wave ii at 1.6558 and red wave iii higher has begun, but we need a break above 1.6715 and more importantly a break above 1.6762 to confirm that red wave iii is developing for a rally towards 1.7490. Short term I'm looking for a move towards 1.6675 followed by a correction, which ideally will find support at 1.6632, but could take us lower to 1.6603 before the next rally higher.

Tuesday, July 16, 2013

Elliott wave analysis of EUR/JPY and EUR/NZD

 EUR/JPY

Since the break above the channel resistance-line we have seen a consolidation, but it should not be long before we will see the next rally higher towards 131.37 and 132.48 as the next targets before the top at 133.81. I see this rally as part of a very complex correction. Short term I'm looking for minor support at 130.25 to protect the downside for a break above resistance at 130.82 confirming the rally towards 131.37 and higher. Longer term I still see the possibility of a deeper correction towards the bottom of wave iv of one lessor degree at 118.73, but it is also possible, that we will get a sub-normal correction price wise, however it is longer time wise.
EUR/NZD

I'm looking for a break above minor resistance at 1.6707 and more important resistance at 1.6756 soon to confirm that the next powerful rally is developing. This next rally will likely take us to 1.7216 as the first target (blue wave iii), but longer term I'm looking for much higher levels. Short term we are looking for support at 1.6637 to protect the downside for the break above minor resistance at 1.6707.

Monday, July 15, 2013

Elliott wave analysis of GBP/USD


GBP/USD

Wave i of 3 went from the high of 1.5752 down to 1.4858 and we saw wave ii of 3 in an expanded flat correction up to 1.5221 and we should now be ready for wave iii of 3 lower towards 1.4334 and more likely wave iii of 3 will extend (after an expanded flat correction always expect an extension) its decline towards 1.3783, where wave iii will be 1.618 times wave i).

Short term we could see 1.5147 and maybe even 1.5164 before the next decline sets in, but under no circumstance can a break above 1.5221 be allowed as that would call for a continuation higher towards 1.5304 before wave ii of 3 is over.

Elliott wave analysis on EUR/JPY and EUR/NZD

 EUR/JPY

With the break above resistance at 130.56 we now must expect a much more complex correction developing. We should now be looking for a move higher towards the top at 133.81. This expected move higher will not be easy to break down, but we will take it step by step. I now expect support in the 130.00 - 130.10 range to protect the downside for the next rally higher towards 131.31 and a break above here will add confidence in a continuation higher towards strong resistance at 133.81. That said, it will take a break below 130.00 to question the rally higher, but only a break below 128.90 will invalidate this call.

EUR/NZD

We have been trading sideways since yesterday, but as long as resistance at 1.6756 protects the upside we could see one last decline closer to 1.6634 before the next powerful rally towards 1.7047 will be seen. However, my first target at 1.7047 should only be a minor bump on the way higher as I expect this rally to very powerful. To invalidate my call for much higher levels, it would take a break below 1.6583 as a break below here will call a decline to at least 1.6440.

Sunday, July 14, 2013

Elliott wave analysis on EUR/USD


EUR/USD

Please see my last post on EUR/USD here first:
http://theelliottwavesufer.blogspot.dk/2013/07/elliott-wave-analysis-of-eurusd.html

As we broke above resistance at 1.3103 I knew, that the count I presented on July 10 couldn't be correct as wave ii is not allowed to break above the starting point of wave i. Therefore I have had to review the entire decline from 1.3262 down to 1.2756 again. I still think the decline from 1.3262 is impulsive in character and therefore we should expect more downside pressure. However, we need to break below support at 1.3000 and more importantly we need a break below 1.2883 to confirm, that the rally from 1.2756 on was a wave ii correction. Therefore as long as support at 1.2883 stays unbroken there is a risk, that the decline from 1.3265 was only a c-wave in a complex expanded flat wave b and that would call for one last rally higher to just above 1.3262 in wave c, but that is not my preferred count. However, we need to stay flexible and wait for confirmation, which scenario is the correct one.

Elliott wave analysis of EUR/JPY and EUR/NZD

 EUR/JPY

We are still locked between the two converging lines. One of this two lines have to give away soon, as we are getting close to the apex. I still thing the most likely scenario is a break below the support line near 129.39 for a powerful move lower towards 128.00 on the way down to 124.96 and possibly lower. However, as long as support at 129.39 protects the downside we could see a move closer to 130.00, but under no circumstances should we see a break above 130.43 and more importantly a break above 130.56, as that would open up the upside towards the high at 133.81 in a very complex correction.

EUR/NZD

We saw support at 1.6583 on Friday, just above my expected support at 1.6577. As we are entering red wave iii of black wave iii we should soon see a very powerful rally higher towards at least 1.7047 and possibly higher. Short term I expect that support at 1.6710 will protect the downside for a break above 1.6806 confirming the next powerful rally higher towards 1.7047. However. if support at 1.6710 breaks, then the potential downside price action should be limited to 1.6646 before the next move higher.

Elliott wave analysis on the Dow Jones Industrial Index - Closeing in on the top.


Dow Jones Industrial Index

Please see my post from June 28 - 2013 here first: http://theelliottwavesufer.blogspot.dk/2013/06/elliott-wave-analysis-of-dow-jones.html

As we have broken clearly above both the channel resistance-line and the top of red wave b at 15,340 we should be headed higher in the final wave v of D of the expanded triangle, which has been developing since early 2000. The target for this final wave v of D should be close to 16,320 and once in place we should see a quick and powerful decline towards the downside.

That said, we might ask our self if we could make a case , where wave iv could be more complex? Yes that is still possible, but then we need to see a top no higher than 15,892 followed by a decline towards strong support at 14,452 in an expanded flat correction. If we are looking at an expanded flat correction in wave iv, that would just mean, that we will have one more chance towards the upside later on. However, It would be prudent to take profit on long equity position on this rally higher, as it could take years before we see levels like these again.