EUR/USD - We could still see green wave iv rallying towards the 1.2362 - 1.2404 in a flat correction, but it is no demand and a break below support at 1.2231 will raise the odds for green wave iv already being over and green wave v down towards at least 1.2158 being under way.
EUR/JPY - Is declining nicely and blue wave v/ black wave iii is hoovering just above its ideal target-area. When blue wave v/ black wave iii is done we should expect a shallow but complex wave iv towards the 98.00 - 98.13 area before the leg leg lower in black wave v.
EUR/NZD - Here too we have decline nicely and is closing in on the ideal-target near 1.5245. However looking at the structure from 1.5487 the is a clear risk that light green wave v extends too, which will most likely cause a break below 1.5245. That said we should trade with the utmost caution here as we a in the absolute final part of the decline from 1.6969. A break above 1.5492 will be the first warning, that a bottom is in place and call for a rally towards 1.6244 - 1.6410 area.
Dow Jones Industrial Index - The decline from 12,961 does look impulsive in character, telling us that wave 3 down is under way. Remember that wave 3 normally is the most powerful and dynamic wave we should be aware of the risk of the bottom suddenly going out of this market.
My ideal target for wave 3 is close to 10,844.
Shanghai Composite - The stealth decline here continues and we should see the ideal target for green wave v at 2,118 tested. However a test of 2,118 will only Mark the bottom of red wave iii, which should be followed by a shallow red wave iv towards the 2,183 - 2,224 area before the next decline towards strong support near 2,074.
Gold - Here too the structure looks impulsive calling for a continuation down towards 1,550 as the first target. That said we still need a break below important support at 1,521 to really scare the bulls and drag out the bears form their caves.
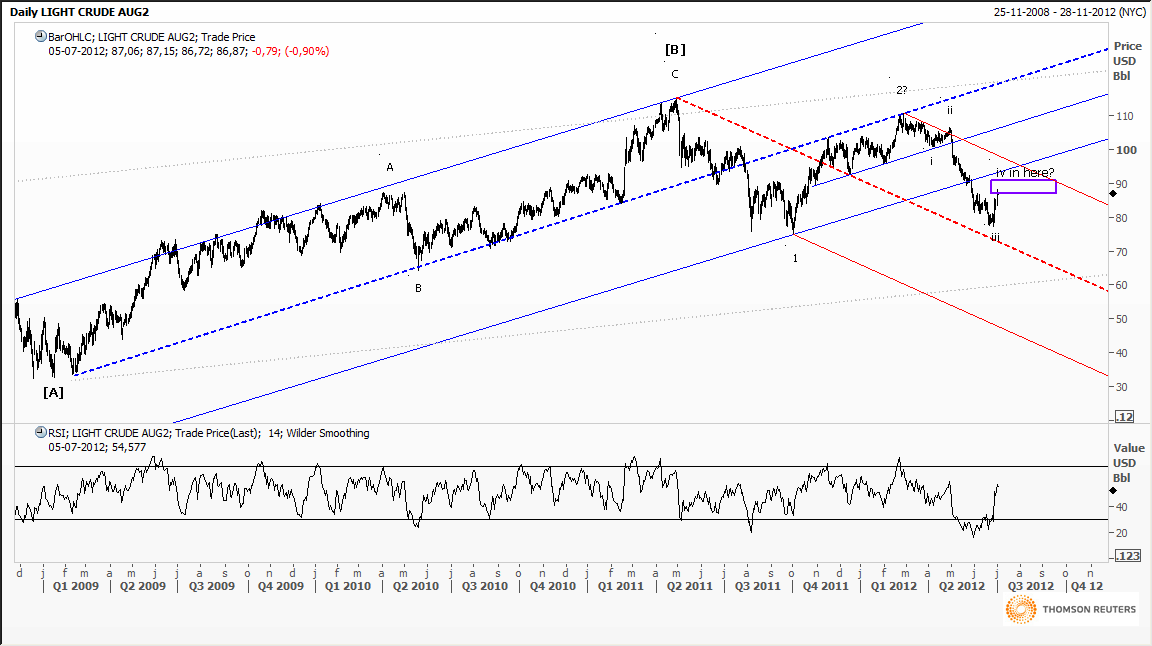
Crude Oil - Odds here favor that wave iv ended at 88.98 calling for wave v down to 72.00. Short term we should now find resistance in the 84.87 - 85.05 area, which ideally will hold for a break below 84.12 confirming the next move lower. At no point should be break above 85.65 as that will force a change of the short term count and cloudy the short term picture.
Wednesday, July 11, 2012
Tuesday, July 10, 2012
Elliott Wave analysis of the USD-Index and EUR/USD big picture
USD-Index - After breaking above the Inverted S/H/S bottom neck-line at 81.63 we have seen a back-test of the neckline, which held with success. All we need now to confirm the next rally higher towards the S/H/S target near 91.61 is a clear break above 83.56.
EUR/USD (Monthly) - Since the low in March 1985 EUR/USD has been locked in a wide rising channel. The rally of the bottom in 1985 to the high in 1992 was copied of the 2000 low to the 2008 in both time a length. In May 2012 the 11 year support-line for the 2001 low was broken signaling a shift in sentiment towards the downside and calling for a decline towards the channel support-line.
EUR/USD (Daily) - Since the 1.6038 high in March 2008 we have been working our way lower in a big A-B-C correction. After finishing the big B - wave Triangle in late October 2011 we should continue lower in a impulsive C - wave towards par longer term.
We are currently in wave 3 down from the October 2011 high. Third waves is normally the most powerful and dynamic of the impulsive waves.
As can be seen on the chart above strong support will be encountered in the 1.1661 - 1.1898 area and we should expect this support to provide a bounce in price it should just be a matter of time before the support-area between 1.1661 - 1.1898 gives away for a continuation lower.
EUR/USD (4 Hourly) - Looking at the sub-waves we are currently correction green wave iii in green wave iv towards support in the 1.2362 - 1.2404 area, which should set the stage for green wave v down towards 1.2122 as the first target for green wave v.
Monday, July 9, 2012
Elliott Wave analysis of EUR/USD; NZD/USD; EUR/JPY; EUR/NZD; DJI; DAX and Gold
EUR/USD - Is working its way lower nicely and more or less as expected. Light green wave iii most likely ended at 1.2231 and we should see a minor correction in light green wave iv towards 1.2381, with a slight chance for making it to 1.2428, before light green wave v takes us down to 1.2207 and likely also towards the 1.2097 - 1.2128 area.
NZD/USD - The decline from 0.8074 still isn't a five wave decline, but odds very much favor one more decline towards support near 0.7855. A decline to 0.7855 will create a five wave decline from 0.8074 and indicate that an important top is in place a call for much lower levels later.
EUR/JPY - Has now broken below important support at 98.30 and wave v towards the ideal target near 94.58 is well under way.
Short term we should be looking for blue wave iv towards the 98.23 - 98.30 area, with a slight chance of a bigger correction into the 98.69 - 99.09 area before blue wave v takes over for a decline towards 95.65.
EUR/NZD - Pink wave v towards 1.5245 is progressing well. We are currently in light green wave iv, which ideally should take us up to 1.5471 before light green wave v takes over for a decline into the 1.5245 area.
I have one "Heads up" thus as both black wave v and pink wave v have extended why should light green wave v not extend? If it does we could see a spike lower to 1.5110 before the decline from 1.6969 is finally over.
Dow Jones Industrial Index - As we have been just a few points below the ideal target-area for wave 2 and the decline from 12,953 does look impulsive we could have begun wave 3 down. However there is a slight possibility, that the decline from 12.953 is wave "c" of an minor expanded flat correction, which means we should see one last new high just above 12,953 and into the ideal target-area.
If we only see a move higher towards 12,862 followed by a break below 12,703 wave 3 is under way, while a break above 12,862 will raise odds, that one last minor high is needed.
German Dax - As is the case for DJI we could well have finished wave 2 and wave 3 down should now be under way. If wave 2 is done we should ideally see a clear break below 6,350. If however support is found at 6,350 odds favors one last rally towards 6,818 before wave 2 is finally over.
Gold - The decline from 1,624.75 does look impulsive and we should soon see the next decline into the support area between 1,565 - 1,567. However the important support is at 1,521 only a break below here will really open up the downside for a much deeper decline.
Friday, July 6, 2012
Elliott Wave analysis of EUR/USD; EUR/JPY; EUR/NZD; DJI; SSEC; Gold and Natural Gas
EUR/USD - If EUR-bulls had any hope left the break below 1.2405 should have them loose it.
We should now be looking for 1.2286 as the next minor support, but it too should be taken out without much trouble as blue wave v makes it way towards 1.2065 as the ideal target for blue wave 5
EUR/JPY - Important support at 98.30 hasn't yet been broken, but it should only be a question of time before it gives away for a continuation towards the ideal target near 94.58, which should mark a long term bottom and call for a major rally.
EUR/NZD - WOW! Support at 1.5522 gave away as pink wave v extends too. There is no way of telling if a wave extends, but looking at the 4 hour chart it is easy to see afterwards.
The break below 1.5522 calls for a re-calculation of the possible extension target and the first lower extension target is at 1.5297 and the second is at 1.5228, which is very close to the ending diagonal support-line.
Looking at the bigger picture (upper chart) we can see that the decline from 1.9563 has become an ending diagonal and that we are in the fifth and final leg lower. The absolute maximum for wave 5 is at 1.4397, where wave 5 will be equal to wave 3, however wave 5 can not go just a single pip below as wave 3 can not be the shortest of the impulsive waves. However I don't expect wave 5 to even come close to 1.4397.
Dow Jones Industrial Index - Has been just a few points for the ideal target-area at the same time divergence seems to be building on the RSI-Indicator, warning that a top could be close at hand. However a break below 12,795 is needed to confirm the top and re-newed pressure to the downside.
Shanghai Composite - Just continues to work its way lower to the ideal target near 2,074. Short term a minor correction in red wave iv is expected, but it should not develop into something serious. I would look for resistance in the 2,234 - 2,244 area, but it could develop into a slightly bigger correction towards 2,265 - 2,286 area, but it's not necessary.
Gold - The test of 1,624.70 was enough and downside pressure should now increase for a new decline towards important support at 1,520. A break below 1,520 is needed to really turn focus towards the downside, but if this support does give away, we should be looking at much lower levels.
Crude Oil - Has now reached the target-area and risk is turning to the downside again. We could still see a move closer to 90.80, but risk/reward again favors focus towards the downside for a move closer to 72.00.
Natural Gas - Seems to be picking up momentum, which is what we should expect in wave 3. A break above the 3.00 handle should soon be seen as we move towards the 3.60 area.
Thursday, July 5, 2012
Elliott Wave analysis of EUR/USD; EUR/JPY; EUR/NZD; DJI; SSEC; DAX; Gold and Crude oil
EUR/USD - Finally we are seeing some action, not overwhelming but still. I'm looking for a break below support at 1.2460 and more importantly 1.2405 to confirm, that wave iii is under way for a decline to 1.2132.
The risk a break above resistance at 1.2627 that will delay the decline for a move towards 1.2787 - 1.2819 first.
EUR/JPY - Here we still need a break below 99.61 to confirm that wave iii down towards at least 96.72 and more likely 95.62 is well under way. As long as support at 99.61 isn't broken, the risk is a break above 100.80 and more importantly 101.39 that will delay the decline for a minor move higher towards 101.54 first.
EUR/NZD - We could well have seen the final long term bottom with the test of 1.5536 (just 3 small pips above the ideal target at 1.5533, but well into the target-zone between 1.5522 - 1.5547)
We should now be looking for a move above 1.5673 as first indication, that the bottom is in place, while a break above 1.5694 will confirm a move higher to 1.5807. However we should see much higher levels and because wave five extended we can give a qualified estimate of the first target-zone, which should be between 1.6244 - 1.6414.
Dow Jones Industrial Index - Is just a few point below its target-zone and risk is clearly turning to the downside again. A break below support at 12,795 will indicate that wave 2 is over and set 12,450 as the next target and a break below here will confirm that wave 3 is well under way.
Shanghai Composite - This stealth decline seems to ecape everybodys attention, but I think it's more important than most. China is clearly slowing!
We are on the way to 2,074 as the first possible target for wave iii. I would expect a minor new bottom near 2,186 for green wave v and red wave iii, but it should only be a pause before the decline towards 2,074.
German DAX - The big picture for the German DAX is not pretty at all. We have begun a new impulsive decline from the 7.194 top. Wave 1 ended at 5,914 and we are currently in wave 2, which might be over at 6,618 or slightly higher at 6,818, but once wave 2 is done the much more powerful wave 3 sets in.
The first long term target for this decline is 4,561, but it could easily evolve into something much more ugly.
Gold - If we didn't see the top at 1,624 on Monday we should just see one small new high just above 1,625 before the next serious decline sets in. I do think the power of the rally from 1,547 has most fooled, but if my count is correct it's only a C-wave and should be followed by a shape decline.
The risk is of cause a break above 1,633, which will invalidate my count and make me the fool...
However in the bigger picture the all important support is 1,520 only a break below here will really open up the downside.
Crude Oil - Has entered it's target-zone and the risk of a reversal to the downside has gone up considerably. However we must allow for a move towards 90.80 before wave iv is done and setting the stage for the next decline to at least 72.00.
Wednesday, July 4, 2012
Elliott Wave Ananlysis of EUR/JPY; EUR/NZD; AUD/USD; NZD/USD; EUR/TRY and Natural Gas
EUR/JPY - Lets start a little different today...
The price-action in EUR/JPY has been minimal, which warns us of a more powerful move once this consolidation is over. I still prefer the downside as the most likely, but as long as minor support at 99.62 isn't broken nothing is for sure. A break below 99.62 should accelerate the decline towards the ideal target near 94.58.
The risk is a break above 101.39 that would delay the decline a tell us, that wave 4 is still ongoing.
EUR/NZD - Is a different story as we are very close to the long term ideal low at 1.5533.
The decline from 1.6969 is a nice five wave decline, where wave v (ongoing) has extended and will be 1.618 the length of the distance travel from the top of wave i at 1.6969 to the bottom of wave iii at 1.6347. When wave v extends this is a quiet normal relationship, but it also warns us, that the coming rally will be quite powerful once the final low is in place.
Looking at wave v we can see some other interesting relationships between the red and pink waves. If we start with the relationships of the red waves at 1.5547 red wave v will be 0.382 times the length of the distance traveled from the top of red wave i at 1.6410 to the bottom of red wave iii at 1.5662. Finally looking at the sub-structure of red wave v (pink waves) at 1.5522 pink wave v will be 0.618 times the length of the distance traveled from the top of pink wave i to the bottom of pink wave iii.
That means we have a cluster of support in the 1.5522 - 1.5547 area, which well could mark the final long term low in this cross.
AUD/USD - As the rally from 0.9668 low now has entered into the area of what I previously counted as wave 1 the impulsive decline count has been invalidated and replaced with a new A-B-C count. That does not mean, that I have turned bullish longer term in this cross. I see the rally from 0.9668 as a new X-wave, which should be followed by a new decline longer term.
Short term we need for the ongoing X-wave to finish. I don't see much more upside, but we get to just below the prior B-wave high at 1.0399, before the next decline sets in.
NZD/USD - The picture here is almost the same as for Aussie above. I have broken the rally from 0.7473 down on an hourly basis (see the chart just above). As can be seen we should be very close to a top. If the top isn't already in place we need just one more high above 0.8063 to finish the rally from 0.7473.
A break below support at 0.7987 will be first good indication that the top is in place and call for a new decline to at least 0.7830, but the decline will probably be much deeper.
The only big question is whether the rally from 0.7473 will turn into a triple correction, but the price-action from the top will reveal that.
EUR/TRY - It has been quite a while since I have spoken about this cross, but as you can see we are now hoovering just above the 2.2125 target I mention in my last post (http://theelliottwavesufer.blogspot.dk/2012/05/elliott-wave-and-technical-analysis-on_03.html)
It's time to be more cautious as we get closer to this target and consider taking a nice well earned profit and just let wave 4 do it's thing. As wave 2 wave a simple zig-zag correction we should expect a shallow but complex wave 4.
Natural Gas - Should soon be ready for the next advance towards the 3.57 - 3.67 area. We now have a very nice inverted S/H/S bottom in place which should attract more positive attention. Longer term I'm still looking for much higher levels, but for now lets focus on the rally towards the 3.57 - 3.67 area.
Tuesday, July 3, 2012
Elliott Wave analysis of EUR/USD; EUR/JPY; USD/JPY; EUR/NZD; DJI; SSEC; Gold; Silver and Crude oil
I am back from vacation. I have used monday to update my charts, so lets jump right into the pool...
EUR/USD - I slightly prefer the above count, that blue wave 4 ended at 1.2747 and that we have begun blue wave 5 down to 1.2064 as the first target.
A break below 1.2551 will add credence to this count, but we need a break below support at 1.2460 to confirm that the above count is the correct one.
The risk is of cause a break above 1.2747, which will tell us, that blue wave 4 isn't over yet and a move higher towards the 1.2783 - 1.2824 area should be seen before we can consider blue wave 4 as done.
EUR/JPY - This count does look very much as the count above in EUR/USD. Here I am looking for one last decline in wave 5 towards 94.58. The question is whether wave 4 did end at 101.62 or wave 4 is still ongoing? A break below 99.61 will add confidence in the fact that wave 4 did indeed end at 101.62, but only a break below support at 99.48 will confirm it. As long as support at 99.61 isn't broken we could see 102.12
USD/JPY - We are in the early start of wave 3 towards at least 86.13. I would like to see a clear impulsive wave towards the upside in wave iii. A break above resistance at 80.00 will be the first good indication that red wave iii is under way for a rally towards 82.43 and maybe even higher.
Until the break above 80.00 and more importantly 80.59 is a reality the risk is that wave ii will be more complex.
EUR/NZD - Wave 5 has become extended and should ideally reach its target near 1.5533 actually it could even extend deeper towards 1.5352, but I would not count on that outcome at this point in time.
We can see the early signs of positive divergence building, which is a warning that a bottom might be close at hand.
Dow Jones Industrial Index: Made a light new high yesterday, which do point us towards the 12,970 - 13,048 area as target for wave 2 of C. Longer term I'm still looking for a decline in wave C towards the 9,662 - 9,916 area, before the next big rally higher.
Shanghai Composite - Is well under way towards strong support near 2,000. Short term I expect resistance at 2,276 to protect the upside for the next move lower towards 2,143.
Gold - Is very close to it's ideal green wave 2 target near 1,611, from where risk again turns lower towards important support near 1,520. However it's only a break below 1,520 which confirms a much deeper decline. A break below 1,600 will confirm that green wave ii is done.
Silver - Is Silver about to confirm the next deep decline ? A break clear break below 26.00 will do a lot of damage to technical picture, but only a break below 21.24 will invalidate the alternate count (the lower chart), that a triangle is building and longer term a new rally above 49.51 should be seen.
If important support at 26.00 protects the downside for a new rally higher towards 32.84 I will give the triangle count slightly higher odds, but a break below 26.00 will raise odds, that important support at 21.24 will be broken too.
Crude Oil - Did the test of 77.28 mark an important bottom ? Not in my view I am still looking for much lower levels in Crude Oil. In My view the decline to 77.28 only marked the bottom of minor wave iii and we should now see a minor rally in wave iv towards 87.03 and maybe even 90.82, but for there risk again turns to the downside for a decline towards 72.65.
Subscribe to:
Posts (Atom)