Wednesday, February 6, 2013

Elliott wave analysis of EUR/JPY and EUR/NZD

 EUR/JPY

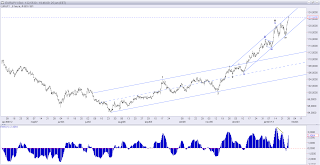
I still expect important short term support at 125.73 will protect the downside for a break above minor resistance at 126.83, which will confirm a new rally higher towards 127.70 and higher towards the next strong resistance target at 128.98. However, we are fast closing in on the possible top for wave 3 and should be careful about our expectation for this ongoing uptrend. Short term a break below 125.73 will be the first indication, that wave 3 has topped, but it will take a break below 124.01 to confirm the top and that wave 4 has taken over.
EUR/NZD

Important support at 1.5752 protected the downside well and we are currently testing the minor resistance-line from 1.6359. A break above this resistance-line will confirm the next rally higher towards 1.6278 and 1.6359 on the way towards the ideal target at 1.6524, where blue wave iii will be 1.618 times longer than blue wave i. Short term we will find support at 1.6043 and important support at 1.5990. Any break below 1.5990 will indicate a much deeper decline and that my count is wrong. 

Tuesday, February 5, 2013

Elliott wave analysis of EUR/JPY and EUR/NZD

 EUR/JPY

Important support at 123.87 protected the downside for a direct break above 126.05, which confirmed that we had one last rally higher coming. As blue wave iii of wave v was slightly shorter than blue wave i of wave v, we now know the absolute maximum length of blue wave v of wave v, which is at 129.77. Any break above 129.77 will force me to reevaluate my count. We are now getting a cluster of Resistance in the 129-area. At 129.18 wave v will be 0.618 times the length traveled from the bottom of wave i to the top of wave iii. At 129.55 Wave 3 will be 3 times longer than wave 1 and finally at 129.77 blue wave v will equal in length to blue wave iii. This means, that I will expect wave 3 to top out in between 129.18 - 129.77 and wave 4 to take over. Short term we will find important support at 125.73 and a break below here will be the first indication, that a top is in place. However, to confirm the top we need a break below 124.01.

EUR/NZD

The channel support-line held as expected for a break above minor resistance at 1.6043, but the rally from 1.5969 is in no way impressive as of yet and we need to see some acceleration higher soon for a break above 1.6158, which will indicate a new rally higher towards 1.6277 and 1.6358 on the way towards 1.6524. Short term we now find support at 1.6043 and important support at 1.5969. A break below 1.5969 will weaken the uptrend seriously and be the first indication, that our count is wrong.

Monday, February 4, 2013

Elliott wave analysis of DJI, Facebook and Apple


 Dow Jones Industrial Index:

Is hoovering just below the important 14,093 resistance level. If this resistance is broken the possibly ending diagonal is history and we should expect more upside to come. However, if resistance at 14,093 protects the upside for a break below 13,329 we should expect a much bigger decline with 10,404 as the first major target. That said, we have to remember, that the uptrend still is in full force and only upon a break below 13,329 do we get the signal, that a top is in place for a much bigger decline.

 Facebook:

Is in its wave 4 correction, which is some kind of flat correction. The first target for this correction is at 27.17, with the possibility for continuing towards important support at 26.51, before the fifth and final rise towards at least 32.83 and possibly even 36.30.
In the bigger picture the rally from 17.55 only marks wave 1 in a much bigger rally. Remember my long term count - You can see it here: http://theelliottwavesufer.blogspot.dk/2012/08/facebook-monthely-close-basis-facebook.html
This count calls for a break above the IPO top at 42.72 for a move much higher later on.

Apple:

Is also in a wave 4 correction, but of a much larger degree. This wave 4 will ideally take us down to 391.00 from where the next rally higher will begin. That said, we have to remember, that fourth waves tend to be very complex in their structure and that would likely mean, that it will not be as straight forward as I just said, but we only have the facts and rules of the Elliott Wave Principle to work with and that will for now call for an ideal bottom at 391.00 and then up in wave 5.

Elliott wave analysis of EUR/JPY and EUR/NZD

 EUR/JPY

The break below support at 124.83 was the first warning, that wave 3 could be over with the test of 126.97. Also the fact, that we had a throw-over of the channel resistance-line and now has broken back into the channel is a warning of a possible top. That said, we still need the final confirmation, which a break below 123.87 will provide. A break below 123.87 will leave us with a an overlap between the possible wave four and wave one of wave v, which is not allowed under the Elliott Wave Principle and therefor will tell us, that a top is in place already. If wave 3 is already in place and we have begun the bigger wave 4 correction, what can we expect? As wave 3 is clearly extended we should expect a minimum correction down to the 23.6% retracement target at 120.68, but a more normal target would be the 38.2% correction target at 116.79, which also marked the bottom of wave iv of one lessor degree. However, as long as support at 123.87 has not been broken we could see one last rally higher, but we need a direct break above 126.05 to confirm that.

EUR/NZD

We are currently testing the new possible base-channel support-line and it will ideally protect the downside for a break above minor resistance at 1.6043 and more importantly a break above 1.6134 to confirm the next rally higher. However, as long as minor resistance at 1.6043 and more importantly resistance at 1.6134 is not broken we could see a move down to 1.5936 and even 1.5881 and still keep the uptrend alive. It will take a break below 1.5750 to invalidate our present count and call for a much deeper decline.

Sunday, February 3, 2013

Elliott wave analysis of EUR/JPY and EUR/NZD


 EUR/JPY

The rally higher is relentless in its climb, but we are closing in on the next important target near 129.18 fast. As long as support at 124.83 protects the downside I will be looking for a break above resistance at 126.97 confirming the next rally higher towards resistance at 127.77 and the important resistance at 129.18. At 129.18 wave v will be 0.618 time the length of the distance traveled from the bottom of wave i to the top of wave iii. This is a very common target for wave v. Short term only a break below support at 124.83 will question the expected rally higher towards 129.18. A break below 124.83 will call for a continuation towards 123.87 and a break below here will confirm that wave v and wave 3 is already in place.

EUR/NZD

Ideally important support at 1.6043 will protect the downside for a break above minor resistance at 1.6158 confirming the next rally higher towards 1.6279 and 1.6359. Longer term I'm looking for this blue wave iii to reach 1.6518, where it will be 1.618 time longer than blue wave i. However, a break below 1.6043 will question this scenario and cause a decline towards 1.5936, but it will take a break below 1.5750 to invalidate my count and call for a much deeper decline.

Friday, January 25, 2013

Ski vacation in Austria.

It's time for my yearly ski vacation in Austria.

Take care and trade safely, while I'm away.

I will speak to you again on Sunday February the 3rd.


Elliott wave analysis of EUR/USD; EUR/JPY; DJI; Gold and Crude Oil

 EUR/USD

Continues to rally higher as expected. We have now tested the minimum target near 1.3485, but I do expect a continuation higher towards 1.3792, where wave C will be equal in length to wave A. That said, we must accept a move even higher closer to 1.4200 before wave E of the large triangle terminates.
 EUR/JPY

The strong rally above 121.28 and more importantly 121.75 does call for a continuation higher towards 1.2452, where wave v of 3 will be 0.382 times the length of the rally from the bottom of wave i of 3 to the top of wave iii of 3.
That said, we should remember that we will encounter strong resistance at 123.27, which was the top back in April 2011.
 Dow Jones Industrial Index.

Continues to move higher, but we will see a break above important resistance at 14,093? Taken into consideration, that we are extremely overbought, that the VIX is at a 17 month low and the leverage is at an all time high. I doubt that we will see a break, but if we do, then the ending diagonal is not a valid count and we must accept a new all time high. However, I find it more likely that a deep correction is looming and could be initiated at any time now. A break below 13.778 will be the first indication, that a top is in place, while a break below 13.365 is needed to confirm the top.

 Gold

The failure to break above resistance at 1,695 is disappointing in regards to the bullish count. The failure raises the risk of a deeper decline towards strong support at 1,527 before the next rally can be expected. Only a direct break above minor resistance at 1.695 eases the downside pressure and indicates a rally higher towards strong resistance at 1,796

Crude Oil

Is still headed towards strong resistance near 105.00. It's still undecided whether we have seen a finished triangle or the rally towards 105 only finishes wave D and one more decline in wave E later on, but for now we should stay focused towards the upside and a test of resistance near 105.00.