Saturday, May 18, 2013
Elliott wave analysis of the USD - Today it's the USD Index; EUR/USD; GBP/USD; USD/JPY; AUD/USD and NZD/USD
USD Index
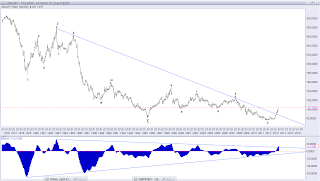
Is the USD Index about to close above the resistance line from late 2005? If we get a monthly close above this resistance line we should expect the USD Index to move much higher.
On the weekly chart I have showed my bullish Count for the USD Index, but we still have some major hurdles to clear to confirm this is the right Count, but this Count calls for much more upside in the USD Index too.
EUR/USD
All we need is a clear break below 1.2745 to confirm that wave 3 is developing for a decline towards 1.1650 and at the same time a clear break below 1.2745 will trigger the S/H/S top.
GBP/USD
I know that many is looking for much more downside in this cross, but that possibility does not fit into my long term Count and therefore I still keep my much more bullish Count open until it has been proven wrong. A new break below 1.4831 will be the first warning, that my bullish Count is wrong and a break below 1.4258 will be the last nail in the coffin and I will have to adopt the bearish Count. But for now I'm holding my ground and keep my bullish GBP Count.
USD/JPY
There is no doubt here. JPY is toasted for a very long term, but that does not mean it will be straight forward and just a one way ticket. Yes it has been that way since September 2012, but we can't expect this rally to keep on going forever, but where do we have the next possible upside target? At 106.20, where red wave iii will be 3.618 times longer than red wave i. However, even if we does see a short term top at 106.20 we should not expect more than brief correction Down to 99.38 and maybe 95.08 before the next rally higher.
AUD/USD
What just happened here a lot of AUD bulls are thinking to them self's. We where looking for wave e of the major wave 4 triangle, but all there is left is hope... Hope that support at 0.9581 doesn't break because a break below here will break the back on every AUD bull out there.
It has in no way been an easy Count and I have had a lot of doubts myself along the way, but the wave 4 triangle just never fitted into any of my Counts, however, the major top at 1.1080 was a perfect Count and that a major downside pressure was close by.
You can see my long term Count here: http://theelliottwavesufer.blogspot.dk/2012/07/audusd-in-long-term-bullish-or-bearish.html
So where are we going from here? I'm looking for decline to at least 0.8544, but I would not be surprised to see a decline down to 0.7940, where we should expect strong support. However for the short term the important level is 0.9581.
NZD/USD
The Picture here is more clear than the Picture for AUD. I'm looking for a long term decline to below 0.7369 ideally to 0.7240 as the first downside target, but Again I wouldn't be surprised to see it lower to the 0.6375 - 0.6400 area. Short term I'm looking for wave iii Down to 0.7801, where wave iii will be 2.618 times longer than wave i.
Subscribe to:
Post Comments (Atom)


No comments:
Post a Comment